This activity uses an anemometer to measure wind speed. The activity take 30-40 minutes on the first day and 5 minutes on subsequent days (7 days total). Intended for ages 11 and up.
What you’ll need:
- Small Anemometer (PH0245S)
- Duct tape or a heavy object such as a brick or a rock.
- Paper and Pencil to record your observations.

Activity Guide:
- Assemble the anemometer by carefully inserting the post into the base and placing the revolving wind cups on the post tip. All of the wind cups should be facing in the same direction (like the picture above)
- Find a location in your yard which is about 4 feet high and away from buildings and other obstacles. You might consider your mailbox post or a deck railing. Make the anemometer stable by either taping it down or putting a weight on it, like a brick or a rock. Be sure to get permission first if you use tape.
- Now step back and, using a stopwatch or a timer, count the number of times the red cup revolves around the post in one minute. You might find it helpful to make a tick mark on a scratch piece of paper each time it goes around and then count the tick marks after the minute has elapsed. Do this three times and average your results. To find the average, simply add the three results and divide by three. For example, if you counted 10, 14, and 13, the average would be
- Record the date and time of your measurements.
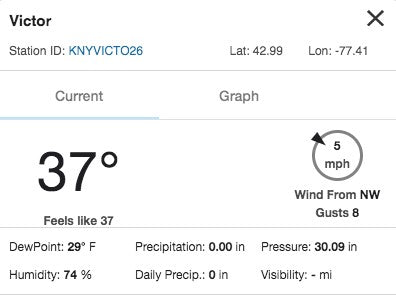
- Now immediately go on the internet to https://www.wunderground.com/wundermap. (Get permission first, of course). Enter your zip code and zoom-in to your town. You will see a number of circles with a number in them and a line coming out of them. Each circle and line shows the location of a weather station. The number is the temperature in Celsius. The line shows the direction and speed of the wind. If you click on a circle, a text box will open and you will be able to see additional information. You can see in the image below that the wind speed in Victor, NY is 5 mph.
- Record the wind speed for the weather station closest to you.
- Repeat steps 3-6 every day for a week. The goal is to have enough data to develop a rough calibration of your anemometer. Use a table like the one below to collect your data.

To calibrate your anemometer, we need to plot the wind speed recorded at the weather station with your own average rotation measurements. Since each anemometer will be different, you will need to determine the appropriate range for each axis, so wait until you have a full week of data before plotting on the chart below. Put your average measurements along the bottom and the measurements from the weather station along the side; see below.
With luck, the points you plot will cluster around an imaginary line. Take a pencil and lightly draw a line along and through the points. Your line won’t touch every point – it may not even touch any points at all – but it will represent where new measurements are likely to end up.
Now when you take a measurement, you can look at your chart and use the line to estimate the windspeed directly.

In some cases your points won’t fall along an imaginary line. This simply means that your wind measurements are not well correlated with the measurements at the nearest weather station. What do you think could cause this to happen?
One thing you could try to fix this problem is to drive to the vicinity of the nearest weather station every day and take measurements near it for a week. Then the results should be very well correlated and you should be able to draw the imaginary line. Be sure to check the wind speed at the time you took your measurements. If you click on the station ID in the text box you will be able to see a plot of the wind speed over the last 24 hours.
Another problem could be that you don’t have enough variation in your measurements. If the wind is the same speed every day for a week, it will be difficult to develop a line. You really need to have measurements at many different wind speeds. You may need to take data for longer than a week to collect this data.


